Tutorial 4 of 7
Scenarios and buffer sweeps
Intermediate 12 min
Clone your model into what-if scenarios, change them, compare them side by side with paired confidence intervals, and sweep a buffer size to find the knee of the throughput curve.
Decisions in a factory are comparisons: two buffers or five?, a second operator or a faster machine?. Twinworks keeps several scenarios of the same model in one project and compares them fairly.
1. Clone a scenario
Open the template Bottleneck demo with buffer sizing and the Scenarios tab on the left. The project already contains two scenarios: the baseline and Bigger buffers around OP30 (B2 and B3 raised from 2 to 6 places).
Click Clone current scenario (or Analyze → Clone scenario). The copy becomes the active scenario, marked editing — everything you change now affects only this scenario. In the clone, select buffer B2 and set Capacity (parts) to 4, then give the scenario a name with Rename and describe the change in the notes field (What is different in this scenario?).
2. Compare side by side
Click Compare all in the scenarios panel (or Analyze → Compare scenarios). Twinworks runs all scenarios with the same replication seeds — the common random numbers technique: breakdowns and cycle times are drawn from the same named random streams, so the difference between scenarios is caused by your change and not by luck.
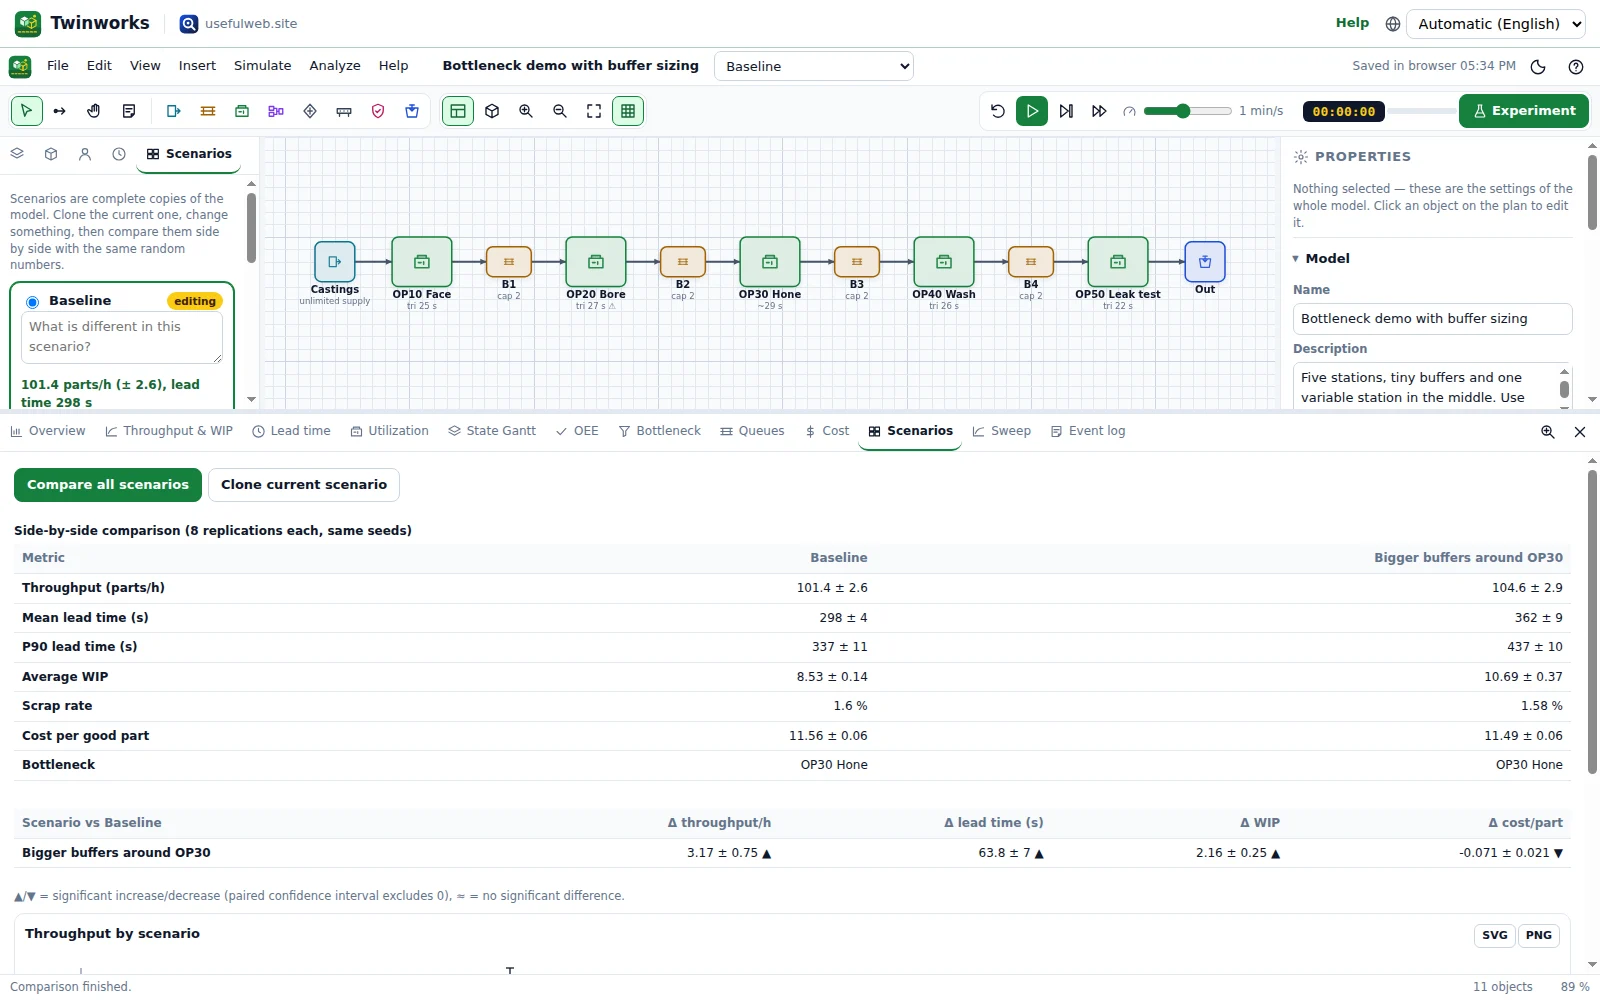
The Scenarios tab of the dashboard shows each scenario's throughput, lead time, WIP, OEE of the bottleneck and cost per good part, plus the paired difference to the first scenario with a confidence interval. If the interval of the difference contains 0, the change is not statistically proven.
Typical outcome: a bigger buffer raises throughput a little, but lead time and WIP grow too — every extra part in a buffer is capital and floor space.
3. Sweep a buffer size
Comparisons answer A or B. A sweep answers how much. Choose Analyze → Parameter sweep… or right-click B2 → Sweep a parameter…:
- Object: B2
- Parameter: Buffer capacity
- From
1, To10, Step1 - Replications each:
6
Click Run sweep. Each point is a full experiment; the chart shows throughput with its confidence band and marks the knee point — the smallest value that achieves most of the possible gain.
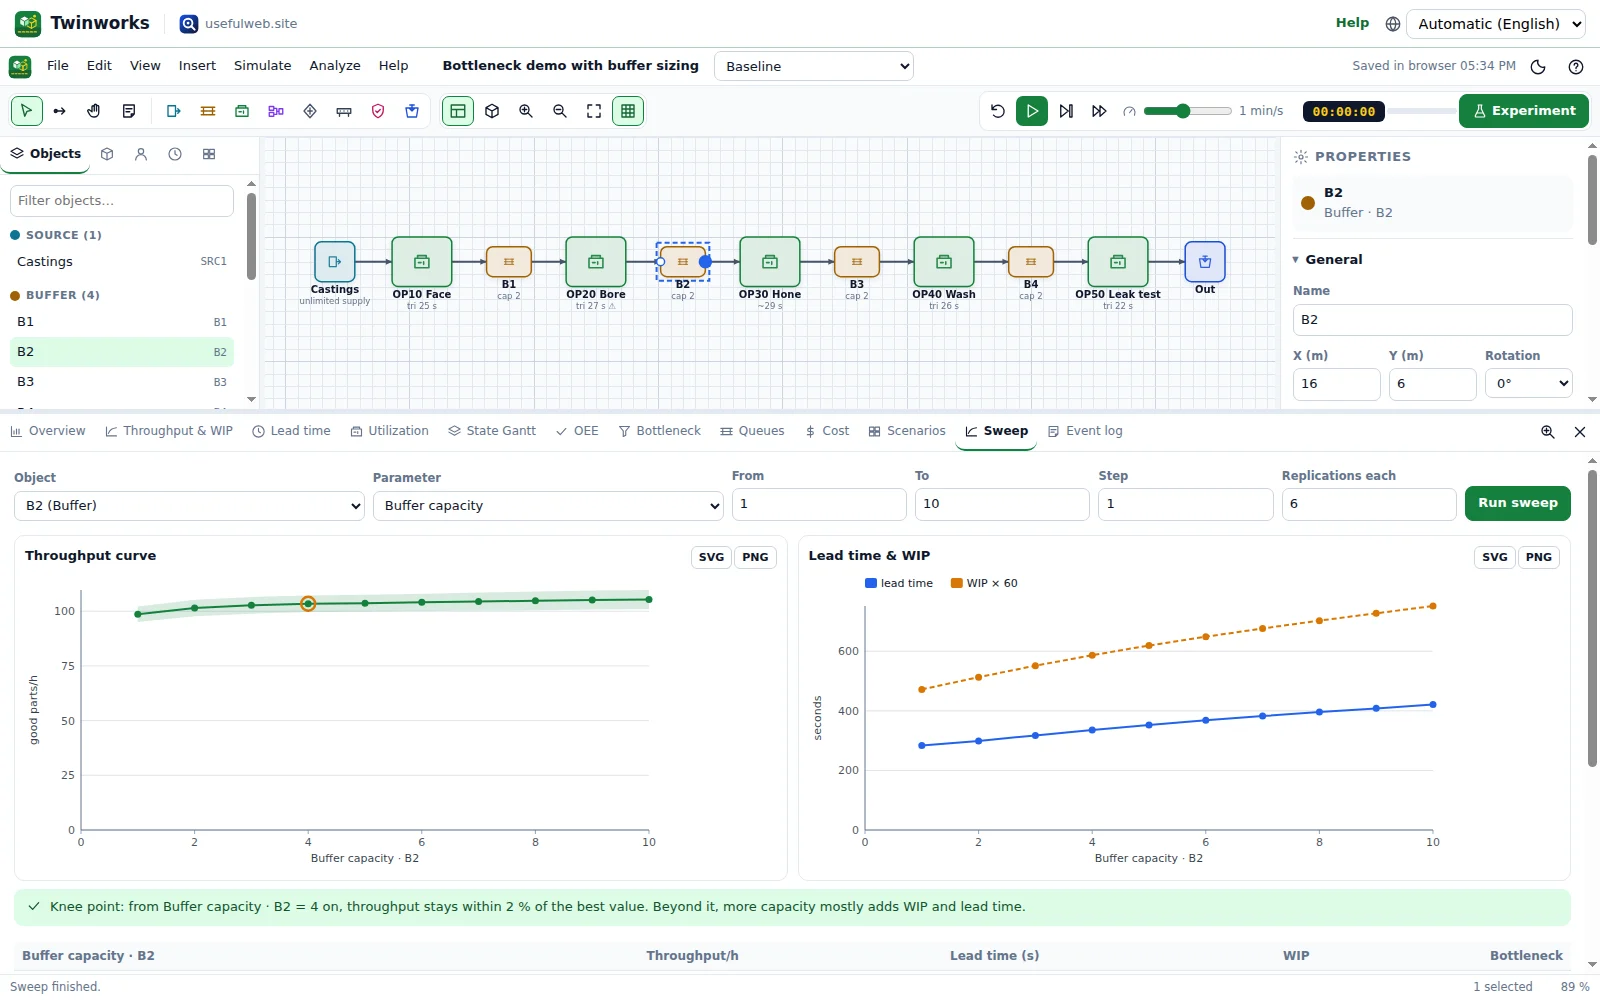
With the API tool twinworks-buffer-sweep (4 replications per point), throughput rose from 99.6 parts/h at capacity 1 to 105.8 parts/h at capacity 8, with the knee at 3. Beyond that, extra places mainly add WIP: the average WIP grew from 7.9 to over 9 parts by capacity 3.
Other parameters you can sweep: parallel servers, cycle time, batch size, inter-arrival time, conveyor speed and length, and the mean repair time (MTTR).
4. Keep the winner
Make the scenario you want to keep active with a click on its card in the Scenarios list. All exports (JSON, CSV, report) use the active scenario. Use File → Save project file to store all scenarios in one .twinworks.json file.