Tutorial 3 of 7
Find the bottleneck
Intermediate 10 min
Use the active-period method, utilization, the state Gantt chart and OEE to find what really limits your line — and test fixes with the what-if analysis before spending money.
Every line has one station that limits its output. Improving any other station does not raise throughput — it only adds inventory. Twinworks finds that station for you and tells you why it limits the line.
1. Open the bottleneck demo
On the start screen choose the template Bottleneck demo with buffer sizing: five operations (OP10 Face, OP20 Bore, OP30 Hone, OP40 Wash, OP50 Leak test) with small buffers between them. OP20 breaks down now and then, OP30 has a highly variable (lognormal) cycle time.
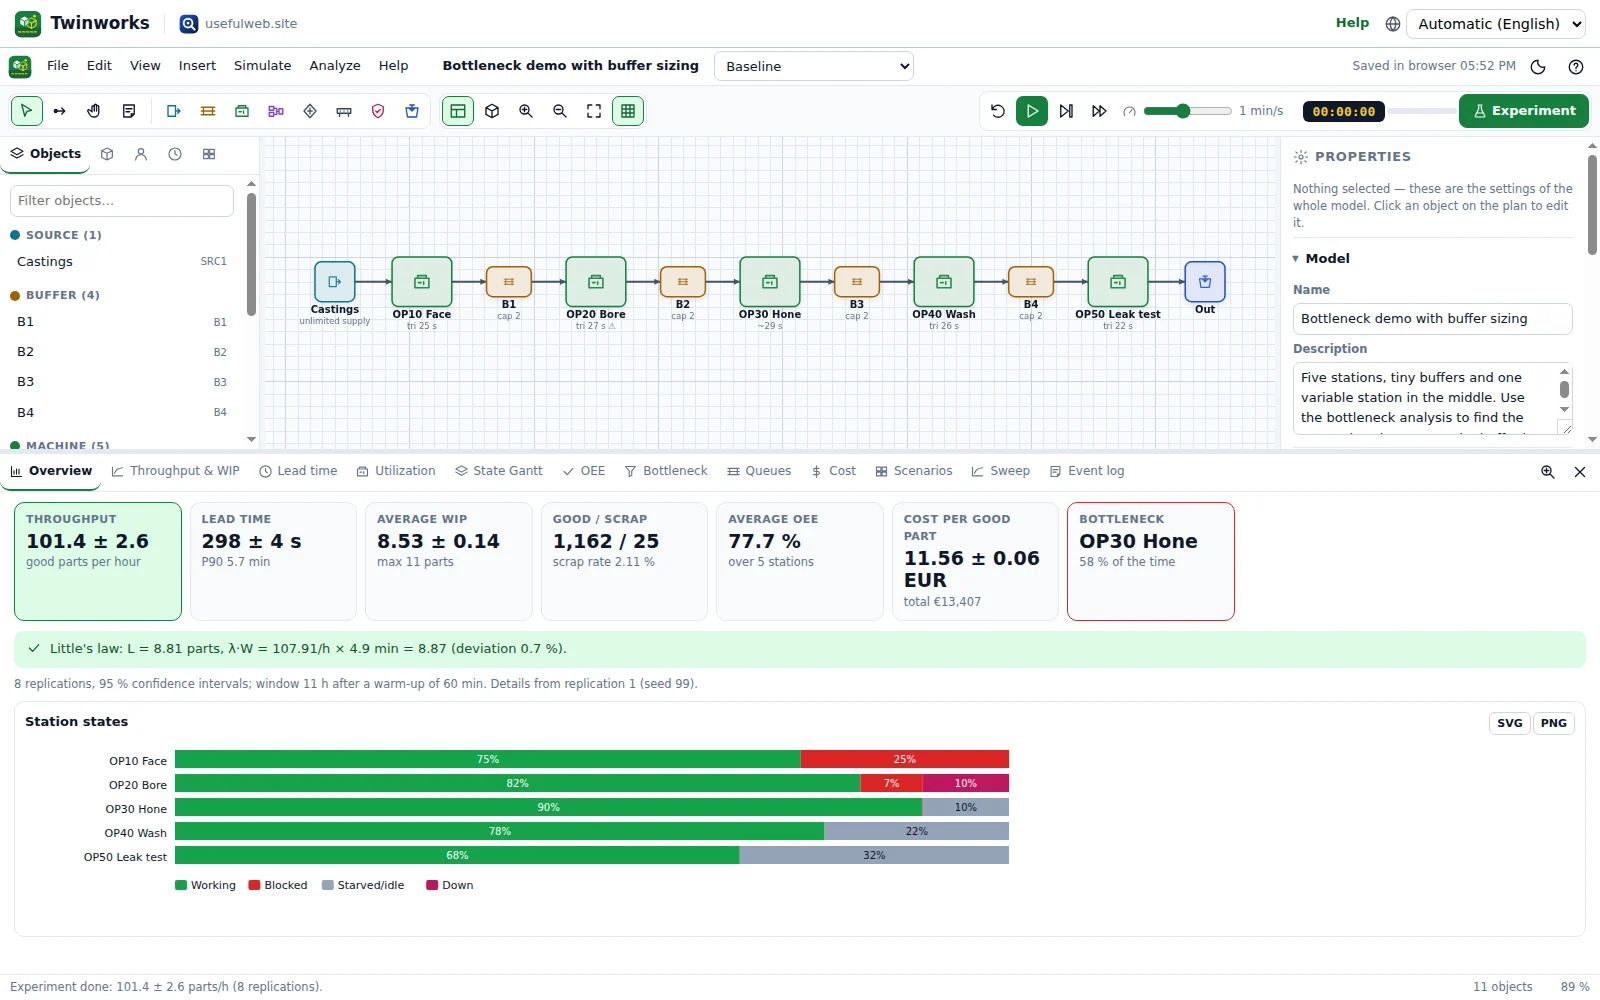
Press Experiment (Ctrl+R). In our run the line made 101.4 ± 2.6 good parts per hour (95 % confidence interval over 8 replications).
2. Utilization is not enough
Open the Utilization tab. Several stations are busy 70–90 % of the time — the busiest one is not automatically the bottleneck. A machine can be busy because it is slow, but another can lose capacity by being blocked (red: the next buffer is full) or starved (grey: nothing to do).
3. The active-period method
Open the Bottleneck tab. Twinworks uses the active-period method (Roser, Nakano & Tanaka): a machine is active while it works, is in setup, waits for an operator, is broken down or in maintenance — everything except starved and blocked. At any moment, the machine with the longest uninterrupted active period is the bottleneck. When two active periods overlap during a hand-over, both are counted as shifting bottlenecks.
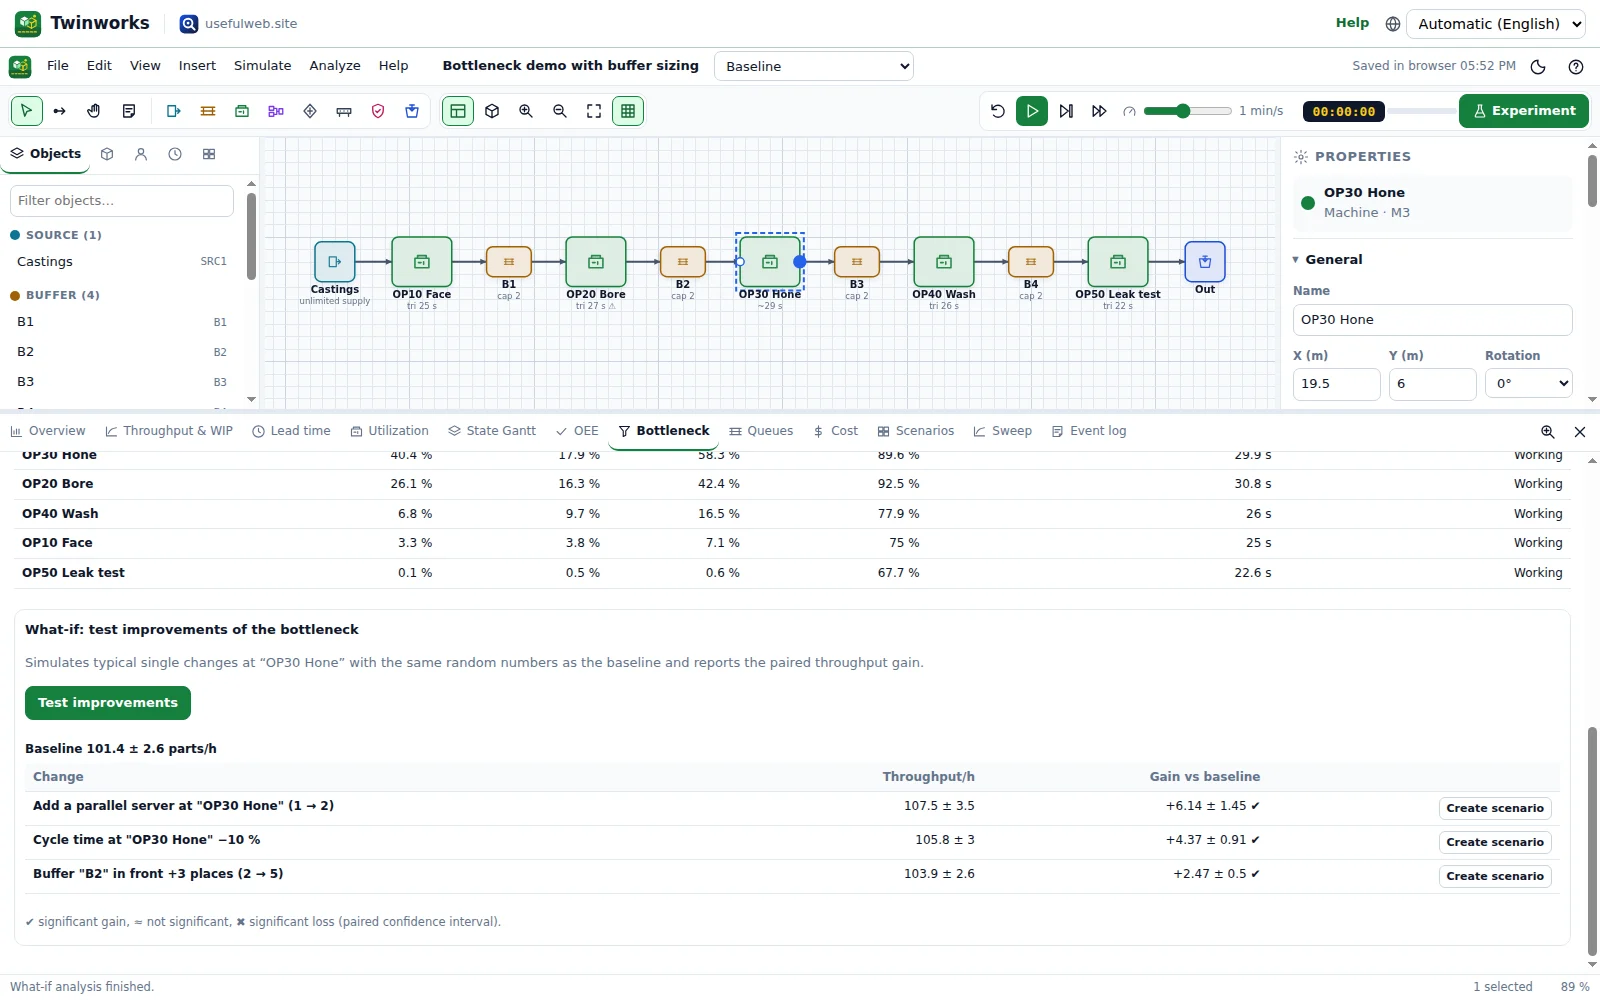
For the demo the ranking (3 replications, as returned by the bottleneck API tool) is:
| Rank | Station | Bottleneck share (sole + shifting) |
|---|---|---|
| 1 | OP30 Hone | 58.3 % (40.4 % + 17.9 %) |
| 2 | OP20 Bore | 42.4 % (26.1 % + 16.3 %) |
| 3 | OP40 Wash | 16.5 % |
So the hone is the primary bottleneck, but the bore takes over a large part of the time — a classic shifting bottleneck caused by variability and breakdowns.
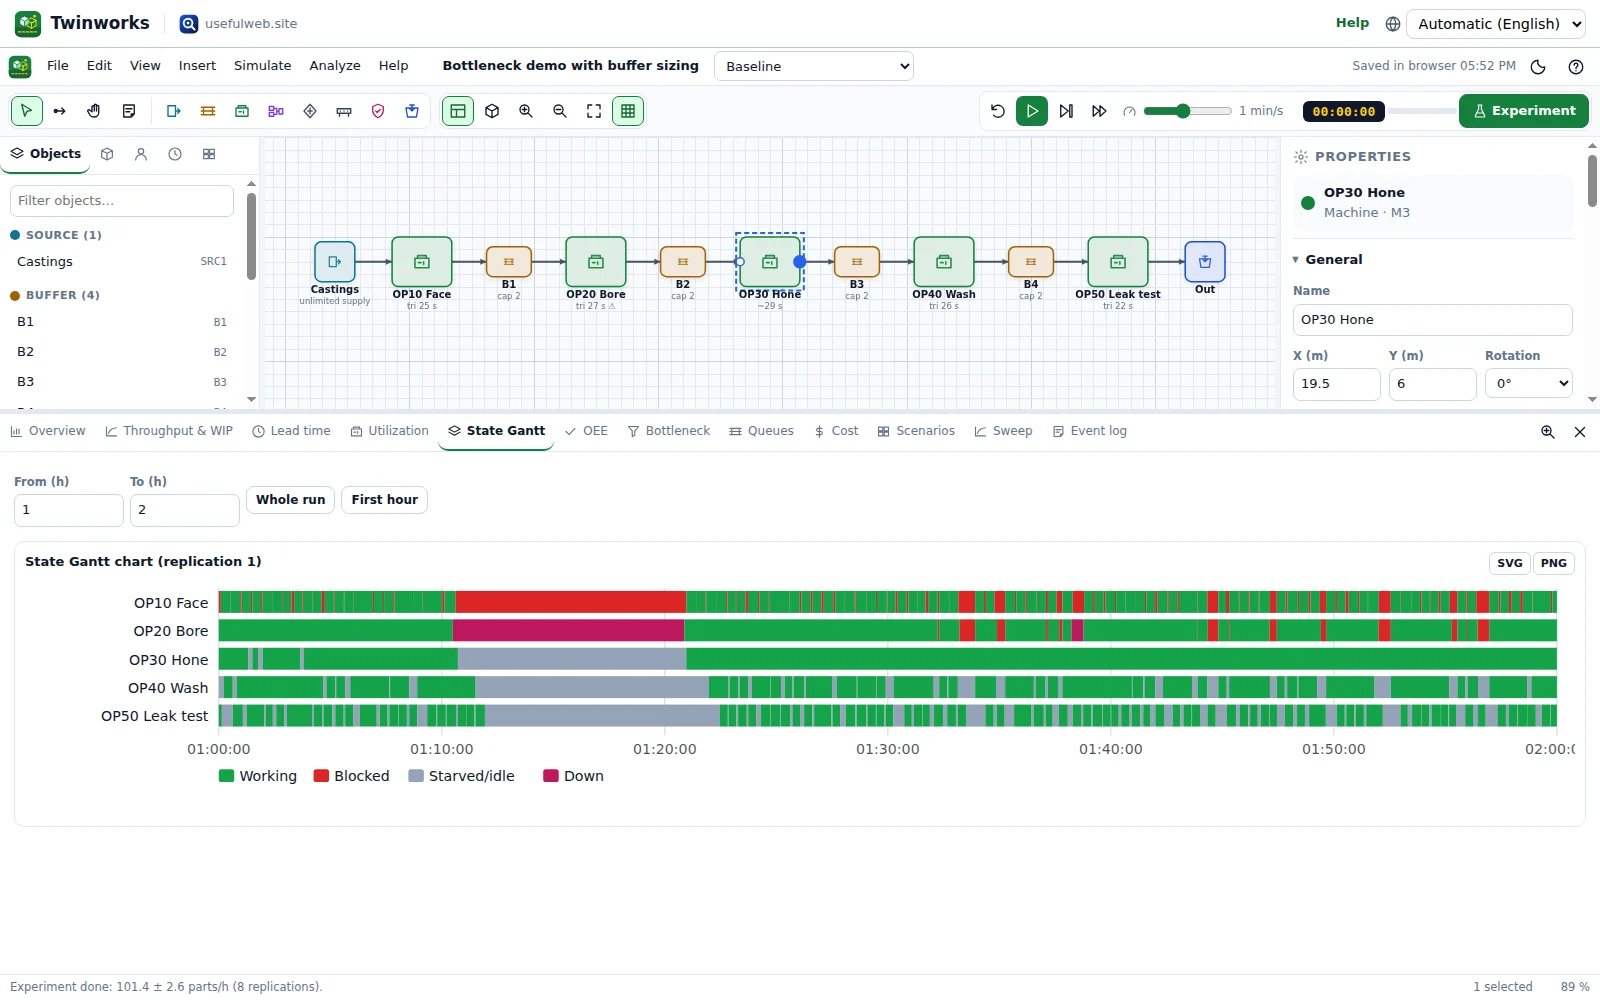
4. Look at the state Gantt chart
Open State Gantt. Each row is a station, each colour a state. Look for patterns: when OP20 is down (magenta), OP10 is soon blocked (red) and OP30 starves (grey) a little later. That's the bottleneck moving.
5. OEE per machine
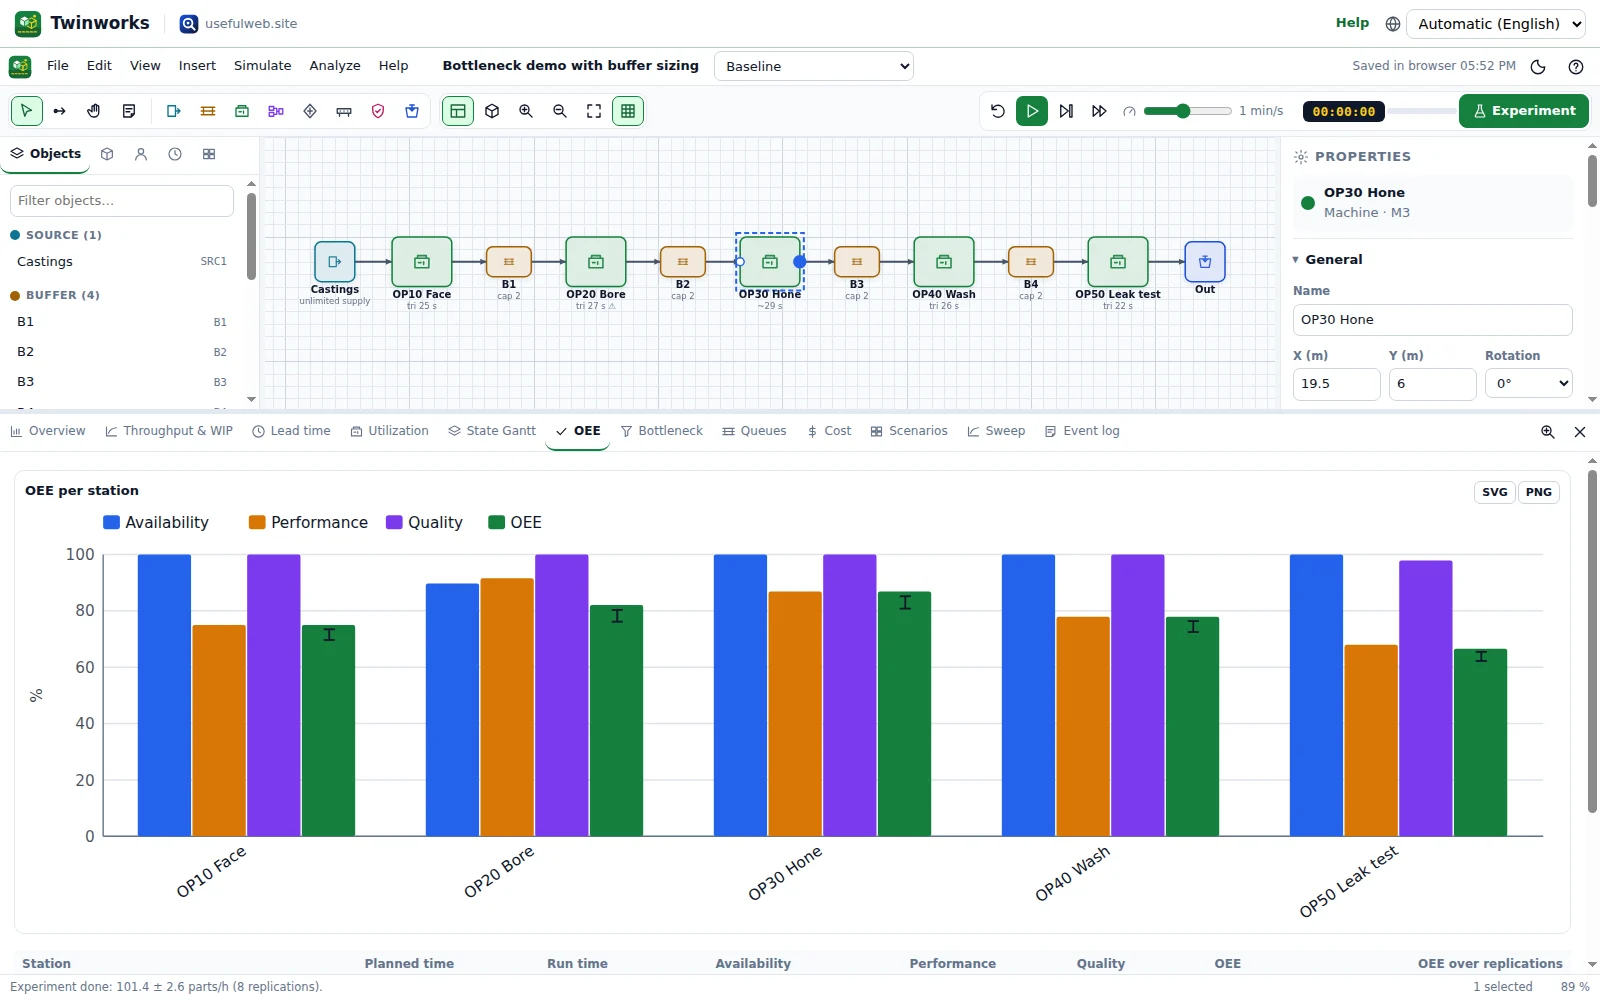
The OEE tab splits each machine into availability × performance × quality:
- Availability = run time / planned time (losses: breakdowns, setups).
- Performance = ideal cycle time × parts / run time (losses: waiting, blocking, slow cycles).
- Quality = good parts / processed parts (losses: scrap, rework).
Planned maintenance and off-shift time are not part of the planned time. A low OEE on a non-bottleneck is normal and not a problem — it just has spare capacity.
6. Test fixes with what-if
Right-click OP30 Hone and choose Test improvements (what-if) (or Analyze → Test improvements of the selected station). Twinworks runs the baseline and several variants with the same random numbers (common random numbers), so the differences are not noise:
- a second parallel server,
- a 10 % shorter cycle time,
- for machines with failures: 50 % shorter repairs (MTTR),
- for machines with setups: 50 % shorter setups (SMED),
- for machines with operators: one more operator in the pool,
- three more places in the buffer in front of the station.
For the hone, a second server gave about +7.9 parts/h (3 replications). The table shows each gain with its confidence interval — if the interval contains 0, the change is not proven to help.
7. Recommendation text
The bottleneck tab also writes a plain-language recommendation, for example:
"OP30 Hone" is the bottleneck 58.3 % of the time (40.4 % sole, 17.9 % shifting): it is simply working most of the time: add a parallel server, shorten the cycle time or move work content to a neighbouring station.
Next: Scenarios and buffer sweeps — how big should the buffers be?