Tutorial 6 of 7
Line balancing and cost per part
Intermediate 10 min
Distribute assembly tasks over stations for a takt time with the ranked positional weight method, turn the result into a simulated line, and read the cost per good part.
Before you simulate a manual assembly line you need to know how many stations it needs and which tasks go where. Twinworks has a line-balancing solver built in (and as the API tool twinworks-line-balance).
1. Open the line balancing dialog
Choose Analyze → Line balancing…. The dialog opens with an example: eight tasks for assembling a wheelbarrow (fit frame, mount axle, fit wheel, attach tray, fit legs, attach handles, grips, final check). Each row has:
- Id and Task name,
- Time (s) — the work content of the task,
- Predecessors — comma-separated ids of tasks that must be finished first (e.g.
C,E,Gfor the final check).
Use Add task and Remove task to edit the list.
2. Set the takt time
The takt time is the time available per unit: available time ÷ demand. With a 450-minute shift and a demand of 270 units, takt = 27000 s / 270 = 100 s. Enter 100 in Takt time (s).
Choose the Heuristic:
- Ranked positional weight (Helgeson & Birnie, 1961): each task's weight is its own time plus the time of all tasks that follow it. Tasks with the highest weight are assigned first.
- Largest candidate rule: the longest task that fits is assigned first.
3. Balance
Click Balance.
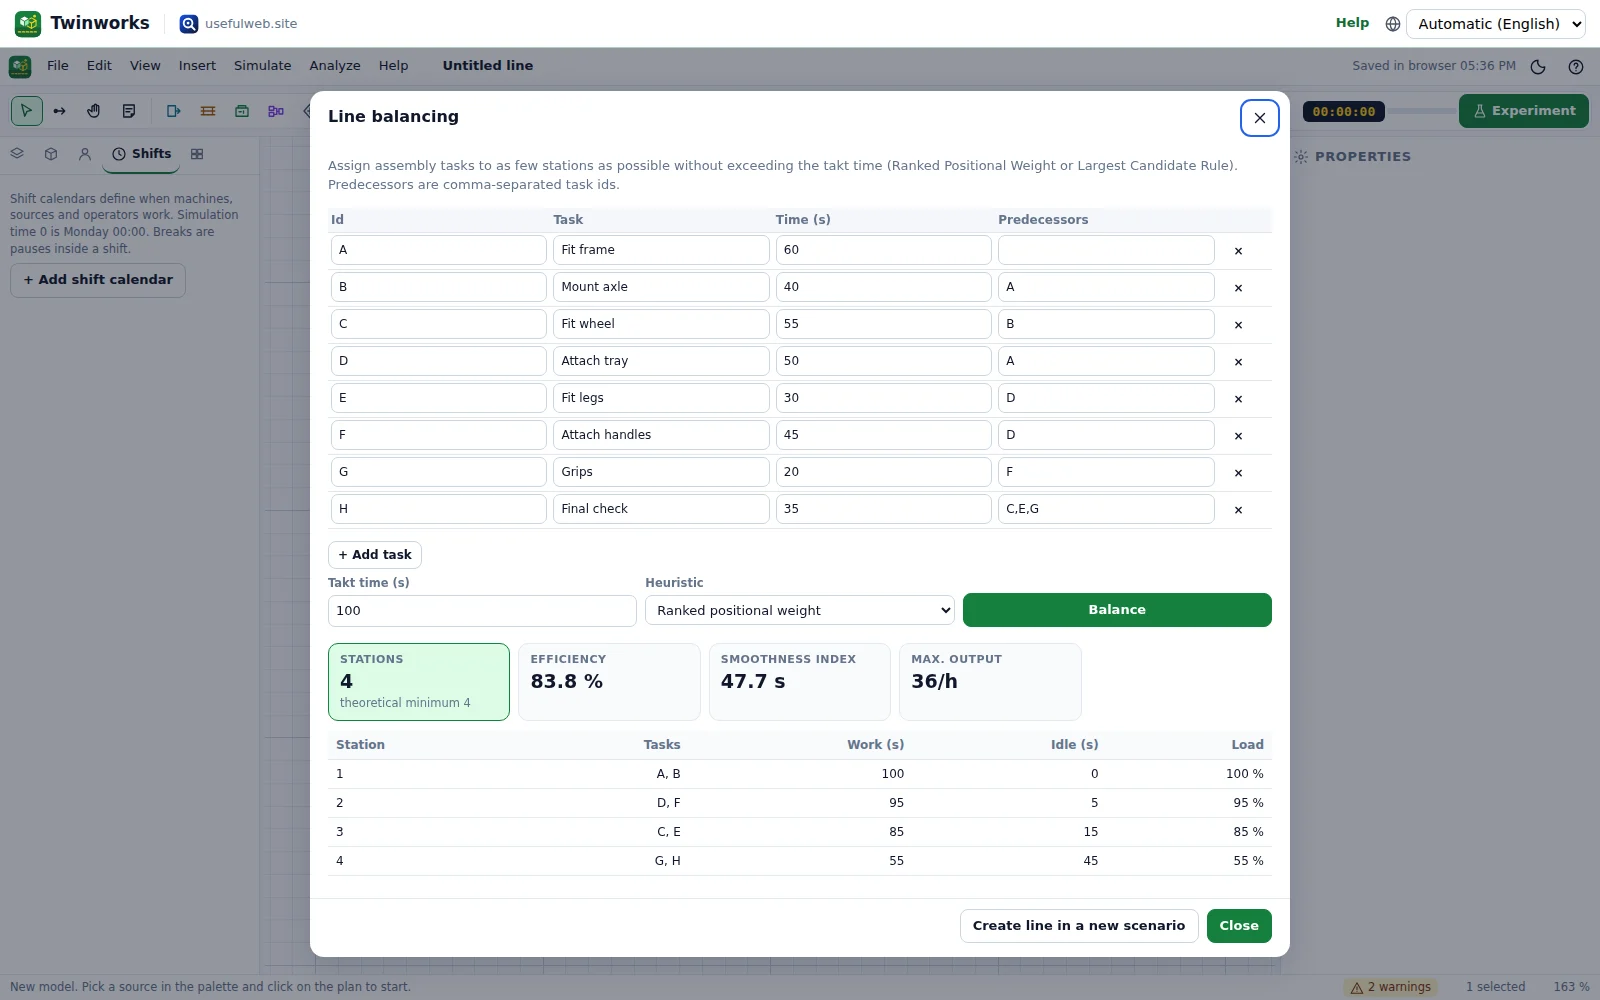
For the example (total work 335 s):
| Station | Tasks | Work | Idle |
|---|---|---|---|
| 1 | A, B | 100 s | 0 s |
| 2 | D, F | 95 s | 5 s |
| 3 | C, E | 85 s | 15 s |
| 4 | G, H | 55 s | 45 s |
- Stations: 4 — the theoretical minimum is ⌈335 / 100⌉ = 4, so this is optimal in station count.
- Efficiency = total work / (stations × takt) = 335 / 400 = 83.8 %; balance delay 16.3 %.
- Smoothness index = √Σ(max work − station work)² = √(0² + 5² + 15² + 45²) = 47.7 s. Lower is smoother.
- Max. output: 3600 / 100 = 36 units per hour (the slowest station sets the pace).
4. Simulate the balanced line
Click Create line in a new scenario. Twinworks builds a line with one machine per station (constant cycle time = station work, the tasks in the station's note), one-place buffers between them, a source and a sink, in a new scenario of your project. Now add realism — variable task times (triangular instead of constant), operators with breaks, a small buffer between stations — and run an experiment. You will see that a balanced line with variability and no buffers produces noticeably less than 36 units per hour: blocking and starving eat the idle time that the static calculation does not see.
5. The cost model
Open the Cost tab of the dashboard (or Analyze → Cost model). The cost per good part combines:
| Cost | Where to set it |
|---|---|
| Machine time | each machine: Cost & OEE → Rate per hour (charged for all the time the machine is on shift) |
| Variable cost | each machine: Cost per part (energy, tooling) |
| Labour | Operators tab: pool cost per hour × paid hours on shift |
| Material | Products tab: Material cost per part released by a source |
| Overhead | model settings: Overhead per hour |
| Scrap | the material and processing already spent on scrapped parts plus Disposal cost per scrapped part |
If products have a Price, the tab also shows revenue and profit for the run. For the template 3-station line the cost per good bracket is about 6.51 €, mostly material (2,062 € of 3,210 € per 8-hour run).
Compare scenarios on the cost per good part, not only throughput: a second machine that adds 5 % output can still make every part more expensive.
Next: Automate with the API / MCP.