Tutorial 2 of 7
Failures, shifts and operators
Intermediate 12 min
Make the model realistic with breakdowns (MTBF/MTTR), planned maintenance, setups on product change, shared operators and a two-shift calendar with breaks.
A line that never breaks and works 24/7 is a good start, but real throughput is decided by downtime, shift patterns and people. This tutorial adds all three to the line from tutorial 1 — or open the template Line with failures & shifts to see a finished example.
1. Breakdowns: MTBF and MTTR
Select the machine and open Failures in the properties panel. Tick Random breakdowns and set:
- Time between failures (MTBF): exponential, mean
3600s — on average one breakdown per hour. - Time to repair (MTTR): lognormal, mean
420s, standard deviation240s — most repairs are short, a few take long. - Failures count: in operating (busy) time — the clock only runs while the machine works. Choose in elapsed time for failures that also happen while the machine waits (e.g. electronics). The hint below the fields shows the expected technical availability.
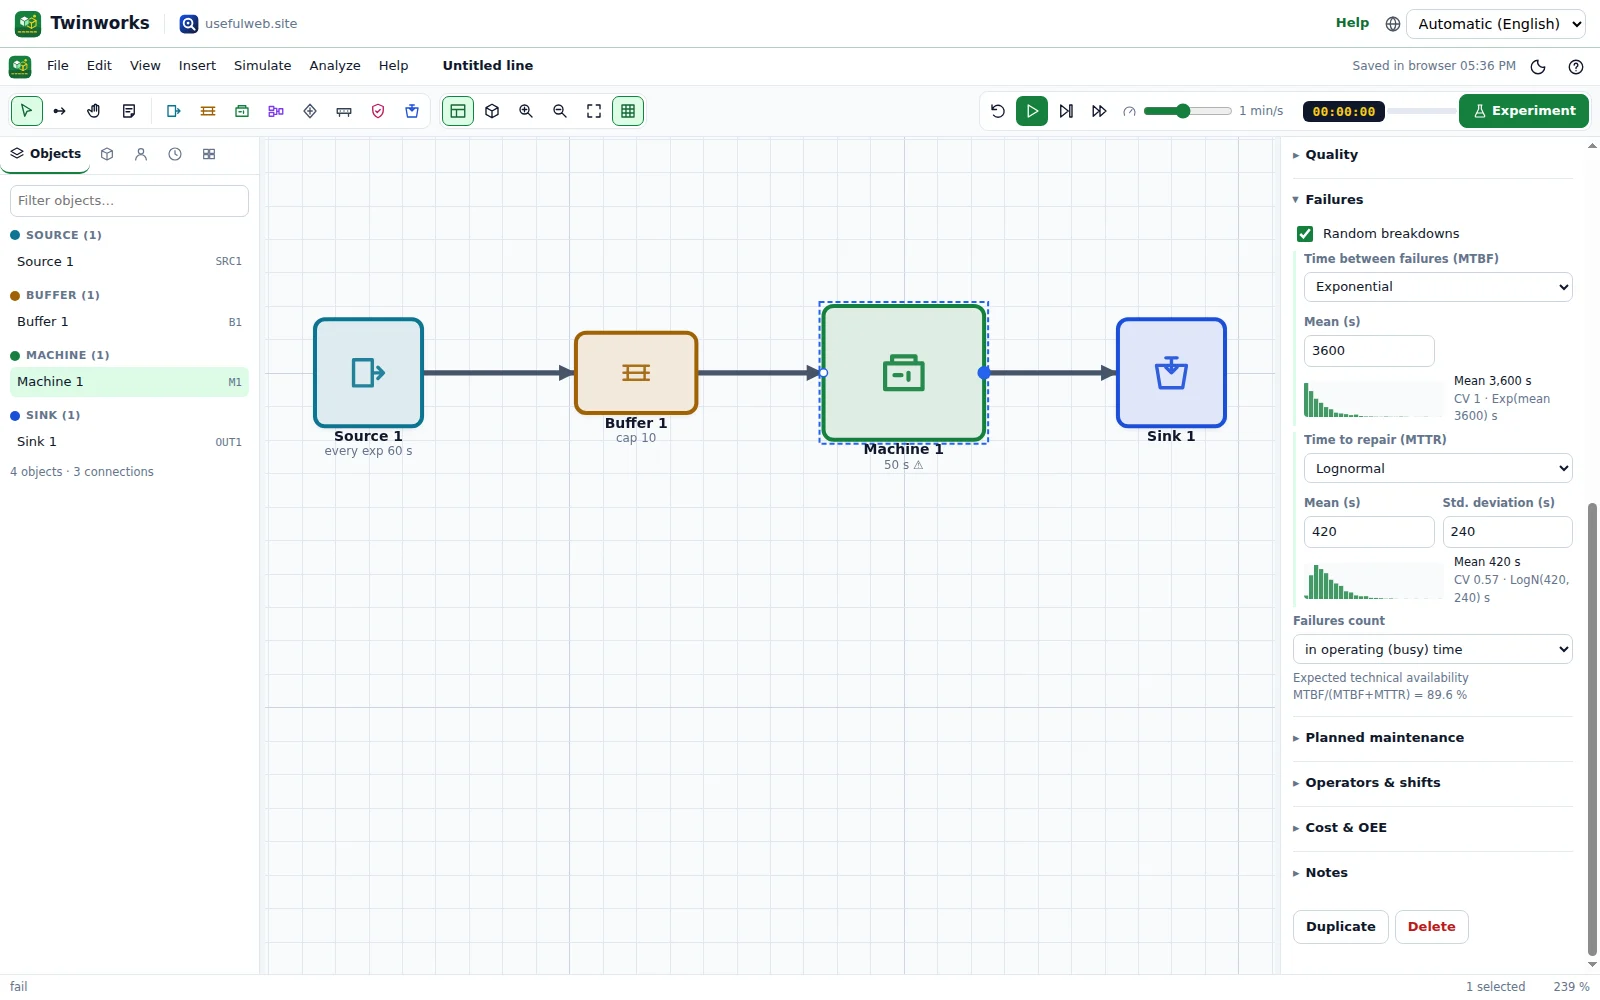
The expected availability is MTBF / (MTBF + MTTR) = 3600 / 4020 ≈ 89.6 %. After a run, the OEE tab shows the measured availability of each machine — over a long run it converges to this value (the engine tests check exactly this).
While a machine is down, it turns magenta on the floor and in the 3D view, and the part on it waits until the repair is finished.
2. Planned maintenance
Open Planned maintenance, tick Planned maintenance and set Every 14400 s (4 h), First at 7200 s and a constant Duration of 900 s. Planned maintenance is shown in teal. In OEE terms it is planned downtime: it reduces the planned production time, not the availability.
3. Setups on product change
If a machine runs several products, open Setup / changeover and choose a setup time distribution. The setup is performed only when the product differs from the previous one. Add a second product in the Products tab on the left and give the source a product mix (e.g. 50/50) to see setups in the state Gantt chart (violet).
4. Shift calendar with breaks
Open the Shifts tab on the left (calendar icon) and click + Add shift calendar:
- Name it
Two shifts Mon–Fri. - Keep Monday–Friday active, switch off Saturday and Sunday.
- Shift 1:
06:00–14:00with breaks09:30–09:45and12:00–12:30. - Click + Shift to add a second shift
14:00–22:00, then + Break for18:00–18:30.
The panel shows the result: 73.8 working hours per week and a small week chart.
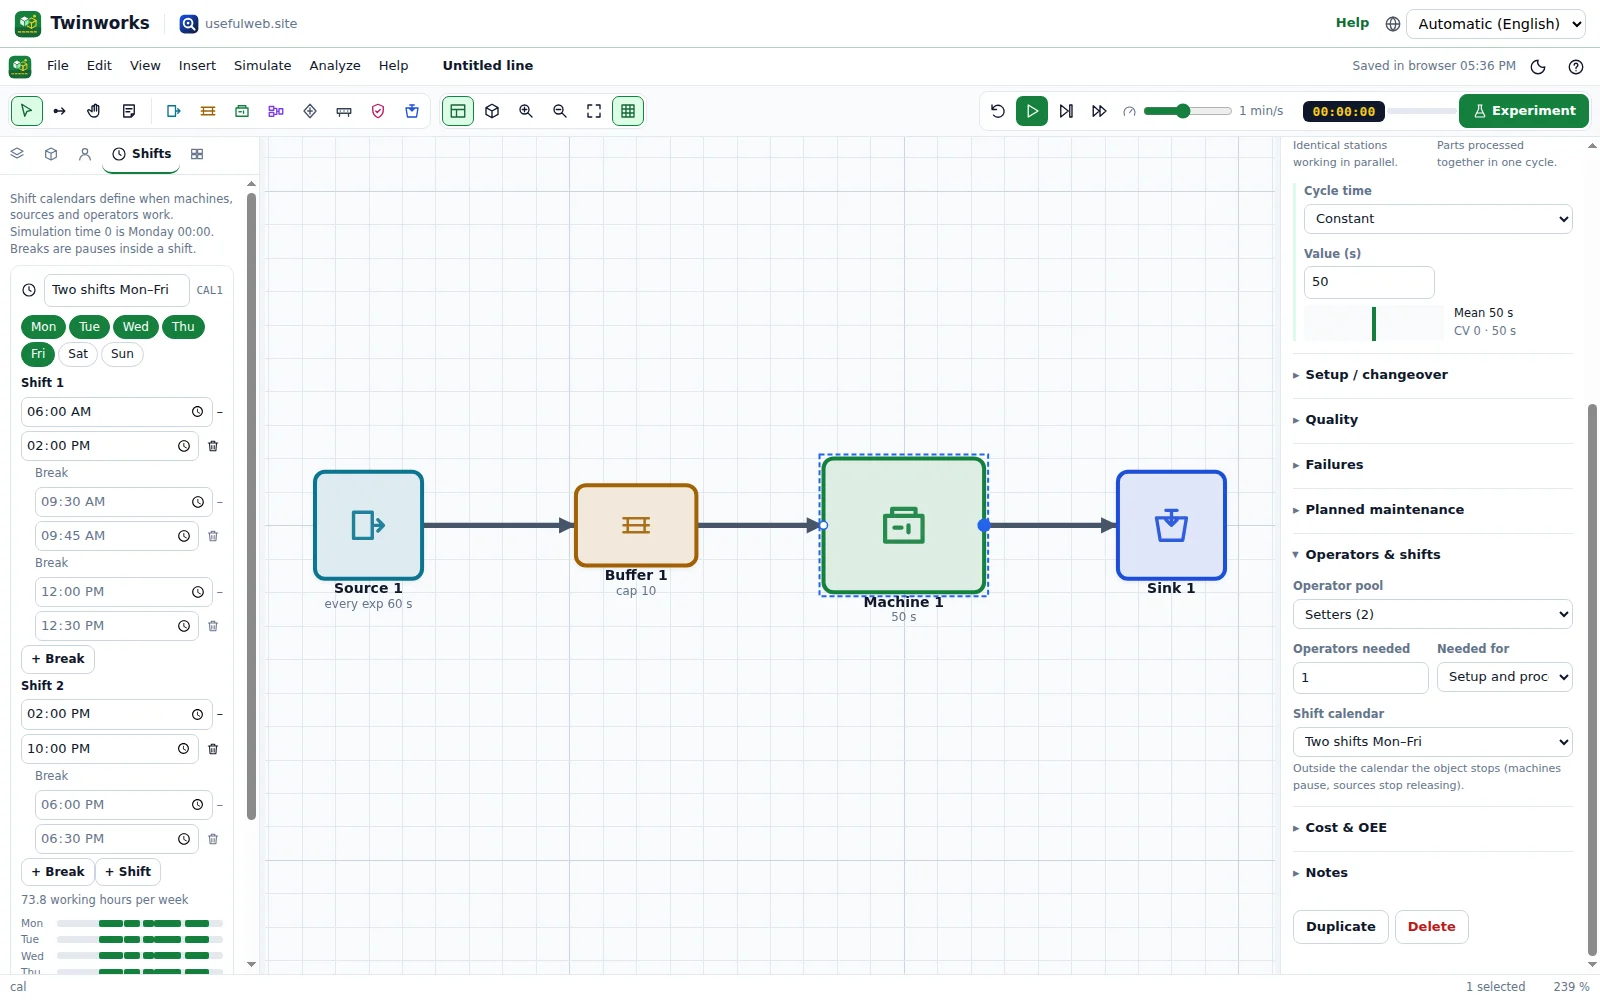
Simulation time 0 is Monday 00:00. To simulate a full week, set Simulate → Run settings… → Run length to 168 hours.
5. Operators shared between machines
Open the Operators tab (people icon) and click Add operator pool: a pool Setters with 2 people, the shift calendar from step 4 and a labour rate of 38 €/h. Then select a machine and open Operators & shifts:
- Operator pool: Setters
- Operators needed: 1
- Needed for: Setup and processing (an operator runs the machine) or Setup only (the setter leaves once the machine runs)
- Shift calendar: the machine itself stops outside the calendar.
When all operators are busy, a machine waits in the state waiting for operator (amber). The Utilization tab of the dashboard shows how busy each pool is.
6. Read the effect
Run an Experiment. Compare the results with the model without failures and shifts:
- Throughput per hour is measured over the whole run length, including nights and weekends. Use the OEE tab to see how much of the planned time is really productive.
- The State Gantt tab shows exactly when each machine was busy (green), in setup (violet), waiting for an operator (amber), blocked (red), starved/idle (grey), down (magenta), in maintenance (teal) or off shift (light grey).
Next: Find the bottleneck.